[20200713] Price Hikes Further With Volume

The stock market continues trading with heavy volume (>1 trillion yuan), with price hikes up gradually. Commodities are generally pricing up in futures market (such as corn, rb, fg, zc, ma, silver, gold, bitumen, fuel oil, L, cotton, sugar, bean, and etc). Never seen market like this…

Due to El Nino effect, rainfall is hitting record in decades, with the water level in Yangtze River is marking highs in years. Army was sent to fight against flood in some provinces, which lots of people were suffering from. Now, the other side of story from stock market is that the government might invest more on building infrastructure, causing the stocks related to materials and infrastructure to hike.

Agriculture sectors received big influx of fund as well, partly due to the weather, partly due to the inflation expectation. Basically, locusts, El Nino, trade conflict with US are the main driving factors of this year’s agriculture stocks and also soft commodities.

Bull market doesn’t lack stories, and stock would just hike. As long as the volume is trading high, the hotness of the bull won’t just go. It’s obviously the right time for momentum strategies.

There’re some economists who have big concern on M2 level of the deeply indebted nation, and worry about debt crisis. I have same worry as well, but if the current situation across the globe, things couldn’t get worse… While, the Chinese government still has some room for monetary/fiscal measures. Maybe the stock market is betting on the expectation from central government?

Strategy: Market Timing Effect On EMA

Common sense is that the market timing doesn’t matter much, or at least it should give very similar result if the overall strategy follows same idea. However, the difference is quite stunning.

The winning ratio (profit/loss stats) and day win ratio (strategy/benchmark) are close, beta is similar.

Measure CrossAbove Ema5>Ema20
Winning Ratio 0.395 0.387
Day Win Ratio 0.497 0.478
Beta 0.38 0.374

The difference lies on, MDD and Profit Factor.

Measure CrossAbove Ema5>Ema20
MDD 23% 40%
Profit Factor 3.47 1.7
Alpha 0.23 0.072

1 MDD is 23% vs 40%
With market timing, the max draw down is considerable lower.
2 Profit Factor is 3.47 vs 1.7
Profit/loss ratio is improved drastically when entering on timing.

Alpha
Alpha is improved when entering with crossabove signal. So can I say that the market timing signal actually generates alpha?

Entry on EMA5 CrossesAbove EMA20
crossabove

Entry On EMA(5)>EMA(20) Rank By P/E:
duotou

Indicator: EMA

Multiplier: 2/(N+1)
EMA(T) = EMA(T-1) * (1-M) + P(T)*M

When EMA(T-1) is not available, we can use P(T-1) as substitute, or use SMA as the initial value.

Use the following data to build test cases:

https://finance.sina.com.cn/realstock/company/sz399814/nc.shtml
Date Close Ema(5) Ema(22)
25mar 1312.18 1287.12 1299.67
26mar 1325.58 1299.94 1301.93
27mar 1320.83 1306.9 1303.57
30mar 1325.71 1313.17 1305.5
31mar 1396.83 1341.06 1313.44
1apr 1368.55 1350.22 1318.23

For 1apr’s Ema(5),
M=2/(5+1)
EMA(T) = 1341.06 * 4/6 + 1368.55 * 2/6 = 1350.223333

Reference:
https://school.stockcharts.com/doku.php?id=technical_indicators:moving_averages

Indicator: MACD

Moving Average Convergence and Divergence (MACD) is measuring moving averages on short and long period, and then collect the information on the distances of the short-period average from the long-period-average.

Usually, short period is using exponential moving average with parameters 12,26,9. The moving average is calculated as:
Avg(T) = Avg(T-1)*(P-1)/(P+1) + Data(T)*2/(P+1)
The short period average is calculated as (12,2).
The long period as (26,2).
The divergence (DIF) is the distance between short and long average.
The DEA is the exponential average of DIF with parameter (10,2).

The parameters can be customized if needed.

1. EMA
EMA1(T) = EMA1(T-1)*11/13 + CLOSE(T)*2/13
EMA2(T) = EMA2(T-1)*25/27 + CLOSE(T)*2/27

2. Divergence
DIF(T) = EMA1(T) – EMA2(T)

3. DEA
DEA(T) = DEA(T-1)*8/10 + DIF(T)*2/10

4. MACD
MACD(T) = (DIF-DEA)*2

When MACD is switching from negative into positive, then it’s buy signal;
When MACD is switching from positive into negative, then it’s sell signal.

Reference:
https://baike.baidu.com/item/MACD%E6%8C%87%E6%A0%87/6271283

DataFrame And Rolling Window In Java

Background
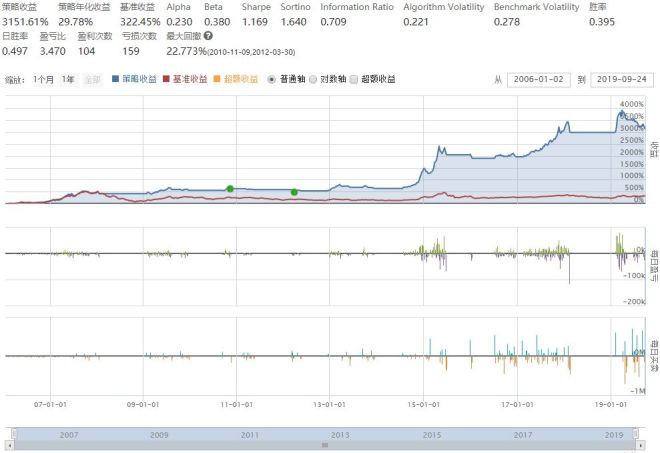
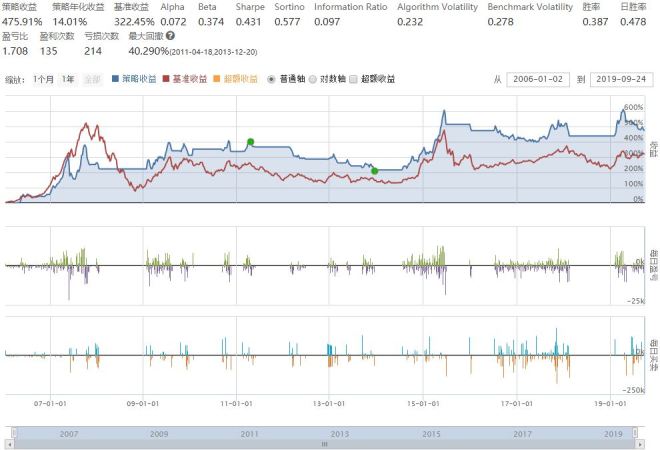
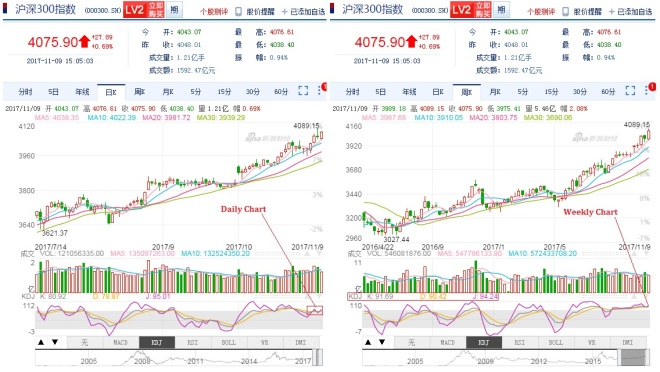
I need some data structure which models sheets in excel, which can hold data like excel does, and perform calculations like excel as well. I’ve tried to run the strategy from excel, but running regression and simulation would easily kill the spreadsheet, because, think about it, there are 300 stocks for calculating indicators, then each day there’s ranking, allocation, and rebalancing.

The calculation logic is straight forward, as I can easily do the prototypes in excel. However, running regression for a period of 5-10years would require help from a proper programming language. Python is one way, but after trying uqer and ricequant (the Chinese version of quantopian and yes they have market data for Chinese stocks) for couple of weeks, I gave up in the end, because the python session would die after running a few iterations of simulation.

So I decided to write a Java version of Pandas, which provides very narrowed features which would suit for my own purpose.

Pandas & Data Structures
Python has popular structures designed to work with it. This entry is trying to borrow the ideas from the two popular data structure (Series & DataFrame) and give myself some ideas when implementing them in Java.

Series
one dimensional array, with labels (index, or keys). holding types can be value, string and objects. The backing structure in java will be a Hashtable, e.g. LinkedHashMap.

Constructor:
1. Array, the keys will be array’s index.
2. Dictionary, the keys will be dictionary keys. (or two arrays with same length, one as key, the other as values.)
3. Scalar value, the keys will be sequential.

Accessor:
1. retrieve a single element via integer based index: series.get(0)
2. retrieve a sub-series via series.get(4,6)
3. retrieve head/tail: series.head(3), series.tail(3)
4. retrieve via label. series.get(key)
5. retrieve a sub-series via series.get(keys)

DataFrame (with reference from here):
Two dimensional data structure, like a sheet in excel, where it has rows and columns. The backing structure in java will be Table (from Guava).
1. Data Type: Columns might be in different types, for example, first column are dates, second columns are doubles.
2. Labels (index, keys) for rows and columns
3. Arithmetic operations on rows and columns

Constructor:
1. rowKeys (by default it’s sequence), colKeys(by default it’s sequence), Data
2. Data type: Lists, Dictionary, Series, Arrays, another DataFrame
2.1. Lists: DataFrame(List list), DataFrame(List lists), eg. DataFrame([1,2,3,4,5]), which will give rowKey, colKey automatically
2.2. Arrays: works similar to lists.
data=[[‘jack’,30],[‘mary’,25],[‘clare’,20]]
DataFrame(data, columns=[‘name’,’age’])
Note that Lists/Arrays should all be in same size.
2.3. Series:
series1 = {‘name’:[‘jack’,’mary’,’clare’]}
series2 = {‘age’:[30,25,20]}
DataFrame([series1,series2], rowKey=[‘row1’, ‘row2’, ‘row3′])
2.4. Dictionary of series (usually, a dictionary of columns)

series1={”:[a:’jack’, b:’mary’, c:’clare’]]}
series2={”:[a:30, b:25, c:20]}
dict={name:series1, age:series2}
DataFrame(dict)

Accessors/Modifier:
1. column seletion: df.column(‘age’)
2. column addition: df.addColumn(Dictionary aSeries), where the added series should have same keys of DataFrame’s rowKeys.
3. column deletion: df.delColumn(columnKey)
4. row selection by RowKey: df.row(‘row1’)
5. row selection by index based integer: df.row(0), df.head(5), df.tail(5), df.row(3,6)
6. row addition: pd.append(Dictionary aRowSeries), where the added series should have same keys for DataFrame’s colKeys.
7. row deletion: df.delRow(0), df.delRow(‘row1’)
8. Dimension: df.dimension(), Direction as X|Y
9. size: total elements
10. values: list of elements from dataframe
11. transpose
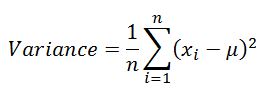
12. count/sum/mean/std/min/max

Iterations:
1. item-wise iterations.
2. row wise iterations.

Window Functions (with reference from here):
1. df.Rolling(window=3).mean()
With window’s feature, I can implement most of the indicators that I’m active using.

Reference:
1. A tutorial on Pandas Series:
https://www.tutorialspoint.com/python_pandas/python_pandas_series.htm

2. Pandas Introduction To Data Structure
https://pandas.pydata.org/pandas-docs/stable/dsintro.html#from-dict-of-series-or-dicts

https://www.programcreek.com/java-api-examples/index.php?source_dir=joinery-master/src/test/java/joinery/DataFrameTimeseriesTest.java

https://cardillo.github.io/joinery/v1.8/api/reference/joinery/DataFrame.html

https://stackoverflow.com/questions/20540831/java-object-analogue-to-r-data-frame

this guy seems update the project quite actively?
https://github.com/netzwerg/paleo

tutorial with 11 bullet points:

https://www.datacamp.com/community/tutorials/pandas-tutorial-dataframe-python

implement some operations for dataframe.

https://dzone.com/articles/pandas-tutorial-dataframe-basics

play on ricequant and revisit dataframe a bit before design in java.

https://www.ricequant.com/research/user/user_337904/notebooks/%E5%8D%81%E5%88%86%E9%92%9F%E6%90%9E%E5%AE%9Apandas.ipynb


EWMA Volatility

Volatility is an important statistical factor for technical analysis. For example, we’ll require volatility for sharpe ratio, sortino ratio and etc.

Typically, we compute the volatility using the following formula:capture

When implementing this into a computer program, there will be practical consideration. For example, computing the variance for stocks of n days will require lots of computation among other computation that the program requires to do; and sometimes a price for a stock is missing then how will this formula be adjusted to the missing price?

By using exponential decay, one can calculate the volatility efficiently. The variance is using 1/n for each deviation factors, while the EWMA will use decay factors to control the average.

capture

Variance(t) = … + mu(t-3)^2*(1-lamda)*lamda^3 + mu(t-2)^2*(1-lamda)*lamda^2 + mu(t-1)^2*(1-lamda)*lamda^1 + mu(t)^2*(1-lamda)*lamda^0

using this expression, we can write the long term for sigma(t-1):

capture
Variance(t-1)= … + mu(t-4)^2*(1-lamda)*lamda^3+ mu(t-3)^2*(1-lamda)*lamda^2 + mu(t-2)^2*(1-lamda)*lamda^1 + mu(t-1)^2*(1-lamda)*lamda^0

substitute this term to the first equitation:

capture
Variance(t) = Variance(t-1)*lamda + mu(t)^2*(1-lamda)*lamda^0
=Variance(t-1)*lamda + mu(t)^2*(1-lamda)

If the variance is calculated daily, today’s variance can be computed using the previous day variance and today’s return.

Reference:
1. exponentially weighted moving average of volatility
http://www.investopedia.com/articles/07/ewma.asp

2. how to calculate historical volatility
http://www.investopedia.com/articles/06/historicalvolatility.asp

3. weighted moving average
https://en.wikipedia.org/wiki/Moving_average#Weighted_moving_average
https://en.wikipedia.org/wiki/Exponential_smoothing

20171109: Prolonged Struggle (2)

Market rebounded today, making the weekly KDJ in good shape again. Since last week, the market has been moving in this fashion, where the technical indicator is switching between strong and weak constantly. Frankly, when KDJ moves to high level, it will experience this kind of problem, where slight changes in the price reading would make the indicator to show weak signals, just like what’s happening now.
kdj_too_sensitive
From the chart above, the left panel shows daily chart, where the KDJ is zigzag these days, showing the unclear direction on the market movement; the right panel shows weekly chart, and when daily K line goes weak, the weekly chart would show “dead cross”, where K goes from higher than D to lower than D, indicating the weakening momentum.
MACD vs KDJ
The weekly chart would not have complete information, unless the market has completed full week of trading. Nevertheless, I’m still relying on the most recently available readings of weekly KDJ for market directions. The good sensitivity of KDJ is the reason why I choose to use it at the first place, with full understanding that the indicator gets too sensitive when KD is at high level. I considered to use MACD for market entry/exit signals; but later realized that it is just too insensitive. It would make you enter market later than KDJ, and also exit market later than KDJ. It’s not a bad thing, but it’s just not suitable for my taste; and the Chinese market generally moves too sensitively, so the MACD won’t give me a good entry/exit time. With this said, if a bull market gets started, MACD would probably perform better than KDJ, simply because you won’t need to enter/exit the market often, hence reduces operational cost and risks. But otherwise, there won’t be too much difference anyway.
In practice, the strategy is supposed to reposition all components by design; but yesterday’s market level is showing exit phase of the strategy, therefore, no repositions have been done, and no stocks shows weakening signs either. Maybe, it was purely luck that makes all compositing stocks performing well when market rebounds. The strategy closes at around +1.7% versus HS300 at +0.75%.
Trump is visiting in Beijing now; and media is saying that he made deals worthy of $250 Billion with China. But, I’m just curious what he would say on the bad smog in Beijing than worry that he couldn’t twitter in China.

Trailing Stop Loss Indicators

1. Chandelier Exit
For uptrend with long position, stop loss is set at CHANDELIER(2)=HIGH(22) – 3*ATR(22).
As the trend is creating new highs, CHANDELIER edges higher together with the trend. However, when the security spot price falls below CHANDELIER, it’s wise to close the position, take a pause and analyze what is going on.
For downtrend with short position, stop loss is set at buy and cover with CHANDELIER=LOW(22)+3*ATR
SHYY-ChandelierExit

Another good reference on chandelier exit can be found here.

2.Parabolic SAR
SAR stands for “stop and reverse”, which helps identify when the trend is stopping and is moving the opposite direction. (And here, here)

2.1 For up trend, SAR is below the prices:
a. EP = Highest(n), the highest of the n sessions.
b. Acceleration Factor (AF): start at 0.02, and increase by 0.02 each time the EP makes a new high. AF can reach to maximum of 0.2.
c. SAR(n) = SAR(n-1) + AF(n-1)*[EP(n-1)-SAR(n-1)]
d. SAR(n) = Min(Low(n-1),Low(n-2), SAR(n)), because SAR(n) can never be above the prior two periods’ lows; if SAR is above of those lows, then use the lowest of the two for SAR.

2.2 For down trend, SAR is above the prices.
a. EP=Lowest(n), the lowest of the n sessions.
b. Acceleration Factor (AF): start at 0.02, and increase by 0.02 each time the EP makes a new low. AF can reach to maximum of 0.2.
c. SAR(n) = SAR(n-1) – AP(n-1)*[SAR[n-1]-EP(n-1)]
d. SAR(n) = Max(high(n-1),high(n-2),SAR(n-1)), because SAR(n) can never be below the prior two periods’ highs; if SAR is below those highs, then use the highest of the two for SAR.
SHYY

3. Hard Stop @ PreviousClose – 2*ATR.

Allotment Shares And Price Calculation

Scenario:
A share with close price of 10, and the investor has 10k position; then the company decides for allotment on shares with 3 shares for every 10 shares, at price of 7. What would be the additional fund required? What would be the new price after allotment?

1 Additional Fund Required
10000/10*3 x 7 = 21k

2 New Price = (Close + AllotPrice*AllotRate)/(1+AllotRate)
(10+7*0.3)/(1+0.3) = 9.31

3 Effect
If the investor decides not to get involved in allotment, then the new NAV = 9.31*10000
If the investor decides to get involved in allotment, then the new NAV = 9.31*13000
But in either case, the investor would need to pay the company, either with cash or with share.

Reference:
1 https://zhidao.baidu.com/question/142827739.html
2 http://www.investopedia.com/terms/a/allotment.asp

Indicator: Calculating KDJ

There parameters required: 1) n is the number of observation days; 2) a is the number of days for smoothing K_n; 3) b is the number of days for smoothing D_n.

Usually, in the market data software, the KDJ is calculated by using parameter triplet of (9, 3, 3), so we got n=3, a=3, b=3

The following example explain the formula by using (9,3,3) to calculate K, D (market data providers outside China seem to omit J calculation)

RSV_n = (C_n – L_n) / (H_n – L_n) * 100

L_n the lowest price in N periods, for this example, L_n means the lowest price traded within the past 9 trading sessions; literally, you need to compare 9 numbers to get it.
H_n the highest price in N periods, which gives the highest price traded in past 9 sessions
C_n the closing price in N-th period, meaning the closing price at the end of observation period; there is only 1 number to get.

K_n = 2/3 * K_n_1 + 1/3 * RSV_n
D_n = 2/3 * D_n_1 + 1/3 * K_n
J_n = 3*K_n – 2*D_n
(Usually, western countries will include K,D only; Chinese stock software will include KDJ.)

if K_n_1, D_n_1 is not available, use 50.

Here is the calculation replicated in excel for reference.

Reference:
1. K&D
http://wenku.baidu.com/view/7e4afea1284ac850ad02428b.html
2. K&D&J
https://zhidao.baidu.com/question/241499189.html