20240307: Forming Bottom

After Lunar New Year, the market has crashed and has been recovering. On 6 Mar 2024 (Wed), all indicators suggested by the strategy suggest to move onto risk assets.

The model allocated the first stock 601600 (大秦铁路). Interesting, this is the value stock that I’ve been tracking, who pays consistent dividend over the past years. Nowadays, one norm of the market is on the value investing, where the fundamental logic might not be the risk on, but instead, the rate cut that’s happening right now.

The fact that the bond market is running bull is due to the rate cut. With the discounting rate decreasing, the bond is benefiting directly and price is constantly moving up. The 5y and 10y treasury bonds that I’ve tracked in CTA model have moved up considerable.

The value stocks who pay dividends consistently benefited from rate cut as well. Such stocks include SOE banks, coal mining groups, railway companies, and etc. From last Nov till this Mar, both banking and mining stocks have increased considerable in market prices.

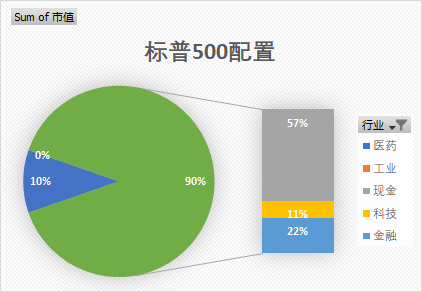
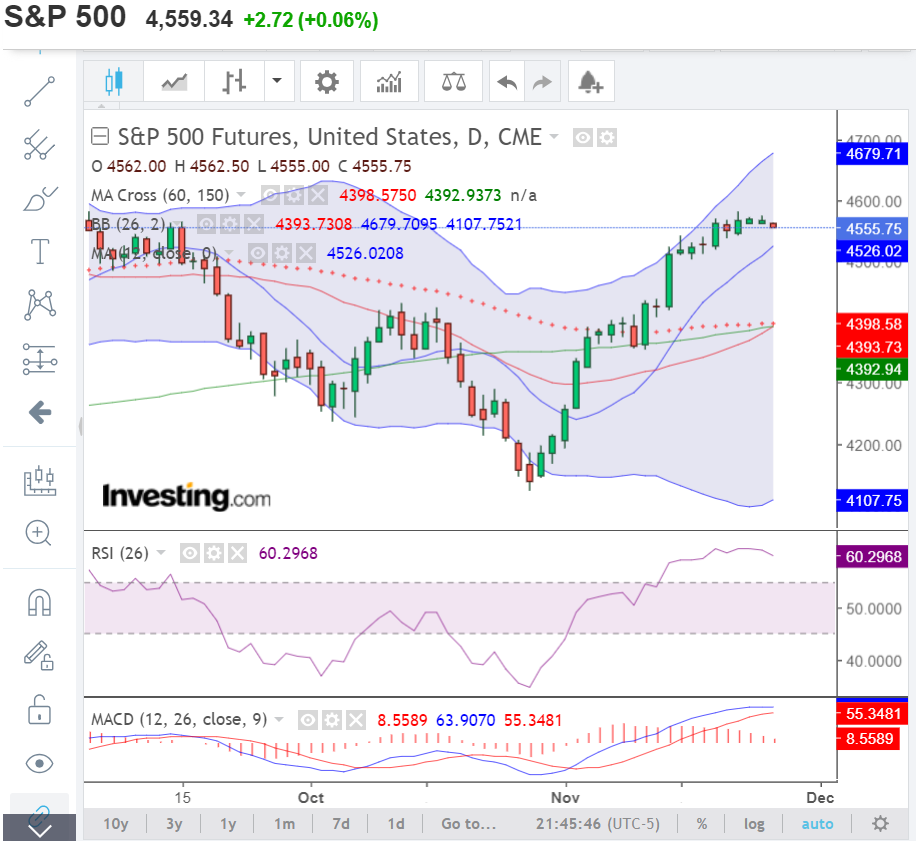
US market is fully allocated; the model is lagging behind the index, but it’s trending up. I would expect that US stock market would have turbulence when the election starts, but I will let the model to work it out, and I just need to track it closely.

Logs For Year 2024

The start of year Dragon is dramatic in stock market in China, where the index crashed to 2635.09 and pulled back to above 2800 before the nation entered into Chinese New Year holiday season.

The drama has erased lots of wealth for those who invested in snowball products linked to ZZ1000 stocks; and lots of quant fund had huge revaluation on their AUM. The chairman of CSRC was replaced by a new guy, who is supposed to save investors from the crisis.

After Chinese New Year, the stock market appears to be climbed out of the crisis and edged above 3000, while the rest of the world continue to enjoy the bull run on risk assets, including US, Europe, Japan, Vietnam and etc.

US would pause rates hikes and might cut rates if inflation is under control; emerging markets could receive investments as dollar rates tops and dollar index starting to decline.

I would expect that both US and Chinese market could offer good opportunities for stock markets. As the start of this year, my portfolio is fully allocated for US stocks.

20231127: Expecting Rates Stale Or Cut

The FED dot plot as of Sep 2023 (appendix 1) shows that rates hike is ending, and expectation is that there’ll be cut in second half of 2024. As recently dollar index starts dropping, world wide stock markets are bouncing up higher.

Over the past a few months, there has been such expectations (rate->dollar strength->commodities) following which the expectations were invalidated. CTA strategies were having drawdowns. Maybe at the turning point, CTA would have such issue when expectation is mixed and not stable.

The Chinese stock market remains weak, after the authority publishes measures and policies to encourage investing. Investors, foreign or domestic, institutional or retail, are coming to realize that the Chinese stock market is a tool for enterprise to cash out rather than giving investors incentives after taking risks. The recent policies try to stop enterprise from cashing too much, which helps to ease the bleeding market. It appears that all the measures that the government delivered have helped market from crashing further, but gives no strength to lift the market, since the macroeconomy is still weak. Appendix 4 shows the divergence of HS300 from SP500, which shows that the recent Xi’s visit to US shows no pushing factor to the market.

The US stock market is picking strength (Appendix 3), after it’s recent adjustment. Given the optimistic rate expectation and seasonal sentiment, the market continues edge higher, which leads to the momentum strategy to start allocating risks to stocks (Appendix 2).

Appendix 1: Dot Plot From FED as of 20 Sep 2023

Appendix 2: Risk Allocation From Momentum Strategy as of 27 Nov 2023

Appendix 3: SP500 Index Shows Strength

Appendix 4: SP500 vs HS300

20230918: Cutting Bank Reserve Ratio

On 14 Sep (Thu) evening, the regulator surprised the market by further cutting reserve ratio for banks by 25bp, to release over 500b CNY to the financial system.

Lots have speculated that the regulator is aiming to support the market; but unfortunately, market still slide further on Friday. Foreign investors continue to pull out from Chinese markets.

The economy is said to be recovering, according to National Bureau of Statistics (NBS), where August had industrial output rose 4.5% beating the estimated 3.9%, and the July had 3.7%. Retail increased 4.6% in August beating estimated 3% against July’s 2.5%.

Commodities usually do not have trending opportunities on Sep and Oct due to the golden week holiday, so I’ve cut the risk allocation to half.

On the other side of the world, SP500 is trading higher, with the momentum model increased allocation to 70%. Lots have been saying that US would have bad year for 2024 and the Street is selling off whenever market rebounds. I wouldn’t bet on where would the peak would be, and continues to follow the trend.

20230906: Stimulus On Properties Market

Chinese government has put further stimulus package on properties market aiming to push up the sliding market. Saver is still getting punished by the even lower rates, while those seeking leverages will find the cost is reducing. This stimulus was implemented in 2nd layer cities but with not much effect, so now it comes into major cities, including Shanghai.

There are speculations that housing price would go further down before it rebounds back a bit, as the stimulus plan was favorable to house owners who wants to upgrade their home.

The market seems to be forming the bottom shape over the past 5 trading sessions. As long as the market is not strong, the strategy won’t start putting in any risks.

Commodities market is rebounding, but August has lost what has gained in July. Typically, September is not a good month for CTA, as October’s golden week comes here. But I will let the model run, and reduce risks when the holiday draws near.

On the other side of the world, US stock market is gaining strength, and the strategy has bought 50% of risks. Lots are speculating that US economy would deteriorate in 2024, so the stock market should seek selling points rather than buying in.

20230829: Stimulus Policy To Rescue

Over the past weekend, there has been announcements on stimulus policies trying to rescue the tanking stock markets, including cutting stamp duty, increase leverage allowance, forbids major shareholders from selling, and etc. Historically, such measures would push the markets up for weeks.

On Monday’s opening, the broad index was as high as 5%, but all indexes were drop for the entire day, till closes around 1%. Lots of investors was in loss if they joined the market at open.

It seems that the regulators fail to realize that the market lacks confidence on recovery of the economy, which has nothing much to do with tax, fees and leverage ratios. I feel safe that my risk allocation remains at 0%.

US stock market has been adjusting as well. The outlook of economy is strong, while central bank considers that they still have room to hike rates to further press down inflations. The market seems to be pricing further rate hikes. The momentum strategy is giving up some of its profit (about 4%), and now with risk allocation of 10%.

20230814: Bear in the play

Bear is in the play for the past month. In fact, the index is trading in weak momentum since end of April till today for more than 3 months, with such weak trend continues on.

The July statistics released have shown that the economy is further weakening (worst in record for the past decades for year to year matching); credit increment is 3459wy for July and short of 3498wy compared with last July, and M2 increment is 5282wy, short of 2703wy compared with last July. There has been lots of policy announcement in the past couple of weeks, but the market does not believe in what the government would put any measures into practice (or even worse that the measure put into practice does no help with the economy).

The momentum strategy has cut its last position in Jul and now holds 0% risks. I feel lucky that I hold no risk on book.

Coincidentally, the CTA strategy has now cut all long positions as well, with flat risk for the past couple of days. Maybe the market starts to realize that the government would not implement realistic measures to help the breaking economy? I’m not too sure…

On the other hand, US stock is showing weakening sign as well, with SP500 trading below the near term average. Momentum strategy has cut 4 positions already, with 2 more to be liquidated for next session to end up with around 40% risk. The US economy still shows strong sign that makes the market prices in further rates hike from its central bank.

20230705: US Stocks Continues Hiking

For the month of Jun, HS300 has nothing much happening. RMB continues downtrend, while the stock index was higher at the beginning of the month and remains dull till the end of the month. Overall, there’s nothing much for momentum trader to do anything.

The portfolio was 20% risk at the start of the month, and dropped to 10% at the end of the month. Account equity has not much changes.

SP500, on the other hand, continues strong trend. The portfolio has allocation on technology (30%), industry (29%), consumption (29%), and healthcare (10%). From start of Apr to end of Jun, the strategy enjoyed 10.37% (vs SP500 8.03%).

Geopolitics continues between US and China, where US is planning to ban China from access cloud services offered by US companies (e.g. amazon, google, and microsoft) to ensure that it takes the lead on AI area. On the other hand, high ranked officials start to visit China. It may seem contradictory, but seems the tie between these two countries couldn’t get any worse.

Chinese government might start money printing to resolve the huge deficit from local governments, as it has rumored. As a matter of fact, the government bond has crashed at closing session on 4 Jul 2023, with more than 3 times of its usual volatility.

Commodities prices are not changing much. The CTA strategy had drawback for around -5% for the month of Jun. I did minor adjustment to the strategy to improve its exit signals.

20230607: US Lifts Debt Limit

The trend continues where Chinese index down with US index up.

HS300 is trading weaker for past weeks, with risk allocation at 20%. Overnight of 6 Jun, the monetary policy is to cut rates further. I would expect that the further deleverage will continue as well because savers won’t get much returns hence prefer to repay mortgages for saving. Geopolitics continues from aerospace to navy.

SP500 continues to trade stronger, after US government lifts the debt limit temporarily and the country avoided defaulting again. NVDA is hitting records high, with soaring demand on AI needs. Currently, allocation is heavily on technologies and healthcare, with minority on industry and consumption.

20230524: Economy Recovery In Doubt

Major stock indexes in China continue the downtrend. The momentum strategy continues to reduce risk and increase cash holding (from 50% to 80%).

There’re news on PE running macro strategies suffering more than 10% drawdown within one week. The macro strategist was very optimistic on economy recovery and has estimated the direction on housing market recovery (hence bullish on stocks on housing, and commodities such as rebar, glass, SA and etc), but recently all these start trending down.

The banking stock (BOC 601988) retreats from recent high of 4.77 to current 3.92 with -17% drops. There’re other SOE stocks suffering similar retracement.

The side-by-side comparison on HS300 and SP500 show that US stock is trading with strength while CN stock has lost its momentum and started down trend.

The momentum strategy has lost its month-to-date gains and starting to have negative returns; while the commodities this month had some lucky bets on longing bonds and some on shorting chemicals with marginal profits.