20240307: Forming Bottom

After Lunar New Year, the market has crashed and has been recovering. On 6 Mar 2024 (Wed), all indicators suggested by the strategy suggest to move onto risk assets.

The model allocated the first stock 601600 (大秦铁路). Interesting, this is the value stock that I’ve been tracking, who pays consistent dividend over the past years. Nowadays, one norm of the market is on the value investing, where the fundamental logic might not be the risk on, but instead, the rate cut that’s happening right now.

The fact that the bond market is running bull is due to the rate cut. With the discounting rate decreasing, the bond is benefiting directly and price is constantly moving up. The 5y and 10y treasury bonds that I’ve tracked in CTA model have moved up considerable.

The value stocks who pay dividends consistently benefited from rate cut as well. Such stocks include SOE banks, coal mining groups, railway companies, and etc. From last Nov till this Mar, both banking and mining stocks have increased considerable in market prices.

US market is fully allocated; the model is lagging behind the index, but it’s trending up. I would expect that US stock market would have turbulence when the election starts, but I will let the model to work it out, and I just need to track it closely.

20230918: Cutting Bank Reserve Ratio

On 14 Sep (Thu) evening, the regulator surprised the market by further cutting reserve ratio for banks by 25bp, to release over 500b CNY to the financial system.

Lots have speculated that the regulator is aiming to support the market; but unfortunately, market still slide further on Friday. Foreign investors continue to pull out from Chinese markets.

The economy is said to be recovering, according to National Bureau of Statistics (NBS), where August had industrial output rose 4.5% beating the estimated 3.9%, and the July had 3.7%. Retail increased 4.6% in August beating estimated 3% against July’s 2.5%.

Commodities usually do not have trending opportunities on Sep and Oct due to the golden week holiday, so I’ve cut the risk allocation to half.

On the other side of the world, SP500 is trading higher, with the momentum model increased allocation to 70%. Lots have been saying that US would have bad year for 2024 and the Street is selling off whenever market rebounds. I wouldn’t bet on where would the peak would be, and continues to follow the trend.

20230906: Stimulus On Properties Market

Chinese government has put further stimulus package on properties market aiming to push up the sliding market. Saver is still getting punished by the even lower rates, while those seeking leverages will find the cost is reducing. This stimulus was implemented in 2nd layer cities but with not much effect, so now it comes into major cities, including Shanghai.

There are speculations that housing price would go further down before it rebounds back a bit, as the stimulus plan was favorable to house owners who wants to upgrade their home.

The market seems to be forming the bottom shape over the past 5 trading sessions. As long as the market is not strong, the strategy won’t start putting in any risks.

Commodities market is rebounding, but August has lost what has gained in July. Typically, September is not a good month for CTA, as October’s golden week comes here. But I will let the model run, and reduce risks when the holiday draws near.

On the other side of the world, US stock market is gaining strength, and the strategy has bought 50% of risks. Lots are speculating that US economy would deteriorate in 2024, so the stock market should seek selling points rather than buying in.

20230607: US Lifts Debt Limit

The trend continues where Chinese index down with US index up.

HS300 is trading weaker for past weeks, with risk allocation at 20%. Overnight of 6 Jun, the monetary policy is to cut rates further. I would expect that the further deleverage will continue as well because savers won’t get much returns hence prefer to repay mortgages for saving. Geopolitics continues from aerospace to navy.

SP500 continues to trade stronger, after US government lifts the debt limit temporarily and the country avoided defaulting again. NVDA is hitting records high, with soaring demand on AI needs. Currently, allocation is heavily on technologies and healthcare, with minority on industry and consumption.

20230522: HS300 More Volatile Than SP500

From the chart covering covid period from 2019-2023, HS300 is hiking faster than SP500 (i.e. with higher slope), and crashing deeper as well.

Interesting enough that the backtesting on the same strategy tracking HS300 and SP500 shows the similar result, where HS300 has higher RoR and MDD (37%/21%) compared to SP500 (17%/14.5%).

20230519: HS300 Down And SP500 Up

Momentum strategy tracking HS300 shows that market sentiment has no changes since 10 May 2023. Risk allocation stays with 50%, with minor adjustment to decrease allocation from banking (20%->13%) and increase allocation to other stocks.

From SP500 perspective, the index starts to breaking resistance level to trend up. There’re reports showing US economy might have soft landing. The general expectation is that rate hike will take a pause and the inflation level is under control by FED. The CPI/PMI are fair. One risk event is the debt ceiling, but it’s under discussions and the expectation is that the ceiling (would be lifted)[https://www.investing.com/news/stock-market-news/dow-futures-tick-higher-debt-ceiling-negotiations-continue-3086155] once again to keep the government working.

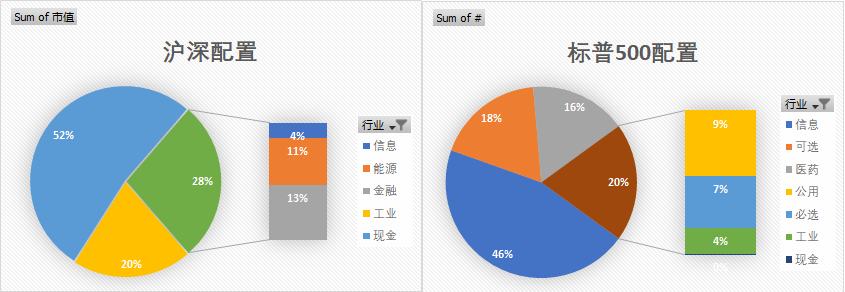
Risk allocation for HS300 and SP500 are listed below.

The chart below shows that SP500 is up and HS300 is down, and such divergence started from March.

20230510: Heat On Revaluating SOE

The broad index is still performing strongly, while HS300 (the core index) under my track is trading flat.

HS300 has topped on 30Jan2023 (the first trading day after Lunar New Year) with 4201.35. There was a week rebound that topped on 18Apr2023 with 4162.03, received sharp decline. Bollinger band is now flat, i.e. the mid band, the upper/lower bands are all flat.

Momentum strategy has 50% on risk allocation, with largest allocation on banking, which is generally speaking holding well in crashing markets.

From media, it’s now a very popular topic on the revaluation of SOE stocks, which happens to be those stocks that in my risk allocation, such ask China Petrol And Chem (600028), Bank Of China (601988), China Railway Construction (601186) and etc.

There’re rising cases of covid infections. With the estimation of 6month of cycle, there could be a new wave of pandemic upcoming.

The tanking stock index might be jointly caused by the covid anticipation and the monetary policies to stop liquidity stimulation. Overall, I would prefer to have less risk than 50%, but be fine to have 50% now and would stick with the strategy’s allocation.

From the CTA strategy perspective, it has bond futures positions, and also gold.

Interesting though, the US stocks are gaining strength, which I have allocated 100% risk for the moment. The driver of US stock might be the bet on halt of rates hikes, and the fairly stable economic data.

20230413: Surging M2

March 2023 has recorded M2 at 281.46T from 275.52T of Feb23, and from 249.77T of Mar22. The surging M2 doesn’t help much with the real economy.

Broad index is still recovering from 2month of consolidation, while the momentum strategy continues to add risk allocation, with about 90% allocated, where top 3 allocated sectors are with industry, financial, and material.

The steam is still running for digital economy and AI, but the momentum strategy is not allocating much to those, while the information sector (8%) are brokerage related stocks, may or may not be related to ChatGPT.

CTA strategies (DEAV3) have very low risk allocation. I’ve been researching ways to earn interest on those unused margins. Apparently, China has released new policies (dated back in 2018) that T+0 funds are mostly banned, which post challenges for cash funds.

20230329: Index Flat and Growth Stocks

Index is almost flat from week-week basis, (3999.44 on 22Mar vs 4007.42 29Mar).

Risk allocation is decreased to 68%, with cash allocation 32%. In the past week, the portfolio cut the only consumption stock (605499).

Main risk is still heavily on SEO, which enjoyed huge hikes in past months, but in recent week, they are losing momentum (not at level of cutting their risk allocation yet).

Minor risk is at growth stocks, as they are picking up momentum due to the fact that: a) the growth stocks are over sold and at historical lows from valuation perspective, b) the policies seems to re-open for innovations as Jack Ma returns to China and appearing from official media. The momentum portfolio has small allocation on Hundsun Tech (600570) and Hithink RoyalFlush Info Network (300033), who are related to AI and brokerages. Over the past week, the hikes of this small allocation managed to pair up the loss from SEO. Maybe they could survive this round of consolidation.

The economy is still weak, after government pumping credit in Jan and Feb. They are missing the point that the general public has no money to spend on consumptions after the 3 years of pandemic disaster, so the created credit won’t help anything for them. Giving coupons to the poor might ease their burden of living but coupon won’t create cash circulating the economy, but reduces such circulation. It seems that the citizen here does not deserve the "helicopter money"; so then maybe they’d figure out other way of saving the economy after crediting pumping fails.

Portfolio allocation as following.

Benchmark index as following. Note that on weekly basis, the price closed slightly higher than last week, but still suppressed under the short term trend line. MACDHISTO is above zero suggesting that the downward pressure is reducing. Maybe the 2-month period (from end of Jan till end of Mar) of consolidation is ending soon.